
We partnered with a US-based producer of organic, plant-based frozen desserts to test drive our hybrid methodology for compiling a corporate greenhouse gas (GHG) inventory. This is the partner company’s first GHG inventory, intended to establish a baseline for annual emissions and a basis for potentially offsetting those emissions.
The hybrid methodology combines two kinds of life-cycle inventory data to quickly and efficiently produce a GHG inventory using CarbonScope:
- All of the emissions in scope 1 (direct fuel combustion) and scope 2 (purchased electricity) are modeled using our process LCI (PLCI) database, which converts physical quantities of energy use into GHG emissions.
- The wide range of emissions in scope 3 are modeled largely using our environmentally extended input-output LCI (EEIOLCI) database, which converts dollar amounts from purchase records into equivalent GHG emissions based on the industry sector and distribution channel.
Corporate structure
The company is classified as a small company (less than 100 employees and/or less than $50M in annual revenue). The company outsources its product manufacturing to two co-packers both of whom are outside of the company’s organizational boundary on an operational control basis, so the entirety of the co-packer emissions will be categorized as scope 3.
Activity data
The company provided activity data for this baseline inventory based on their operations in 2019, using our standard data template for hybrid GHG inventories. The actual data is confidential, but here is an example of what the input data might look like for a hypothetical company. The activity data typically includes:
- Fuel and electricity consumed in company operations – in physical units such as kWh, gallons, etc.
- Goods and services purchased (inflows) – in 2019 US dollars excluding taxes
- Waste management services purchased– in 2019 US dollars excluding taxes
- Freight transport services purchased– in 2019 US dollars excluding taxes
- Warehousing and storage services purchased– in 2019 US dollars excluding taxes
- Energy used in processing and use of sold products– in physical units such as kWh, gallons, etc.
- Employee travel and commuting—in passenger miles or km
The larger of the two co-packers was able to provide their detailed activity data separately. The smaller co-packer was modeled as a supplier providing frozen dessert manufacturing services within the company’s purchased goods and services.
The company sources 100% of its electricity from renewable sources supplied by the local utility. The larger co-packer produces about 3.2% of its electricity using on-site solar, with the remainder sourced from the local grid.
Some of the plant-based ingredients used in the dessert products are imported, which are modeled using domestic production as proxy by assuming that imported commodities have the same input structure and the same production characteristics as comparable products of equal value produced domestically (see this methodology note). While all of the purchased ingredients are organically produced, the inventory uses emission factors for industry sectors as a whole without distinguishing between conventional and organic production. This can be justified by the fact that organic farming does not necessarily have lower carbon footprints than conventional farming when systems are in steady state.
Inventory results
The results of the GHG inventory analysis show that the company’s operations from all three emission scopes amount to 8387 metric tonnes of CO2e for the year 2019. The table and chart below show a detailed breakdown (units: Carbon in Kg CO2e; Energy in MJ; Water in L).
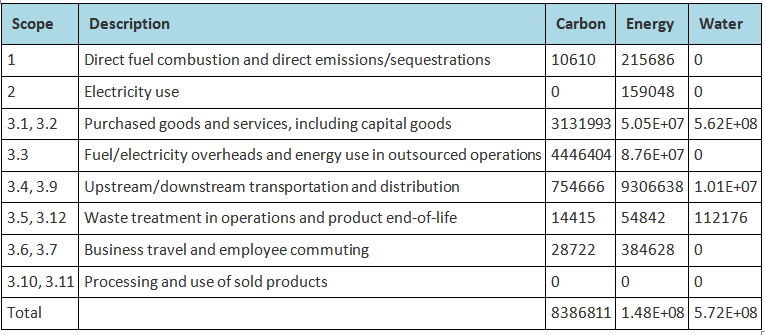
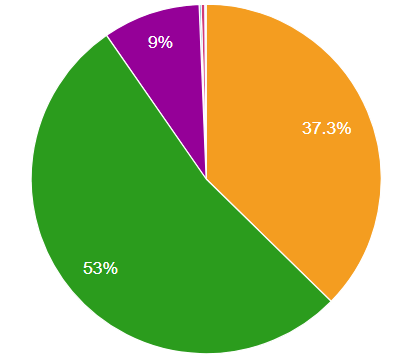
A sensitivity analysis shows that the natural gas used by the larger co-packer is by far the largest contributor to the corporate GHG emissions, accounting for 49% of the total emissions and reported under scope 3.3. The next four contributors are the ingredients sourced by the larger co-packer (16.6% of total emissions; scope 3.1), manufacturing services provided by the second co-packer (9% of total emissions; scope 3.1), truck transport services used to ship finished products (7.6% of total emissions; scope 3.9), and cardboard containers used to ship finished products (3.8% of total emissions; scope 3.1). Overall, scope 3 emissions account for over 99% of the total emissions and 72% of the total emissions are attributable to the larger co-packer.
For a hypothetical company with revenue at the midpoint of the range for the company size, the GHG emissions intensity is 0.36 Kg CO2e per dollar of revenue. This intensity is less than 50% of industry average for the ice cream and frozen dessert sector in the US.
Effort
We said at the outset that our hybrid methodology provides for a quick and efficient way to compile a corporate GHG inventory. Here is a quick accounting of the time and effort that went into generating the inventory:
- About 2.5 weeks of work by the company’s sustainability team to collect activity data from within the company and from the co-packers.
- A few hours to automatically import the data into CarbonScope, generate results, and review/interpret the results.
With a baseline GHG emissions inventory established using a simple and well-understood methodology, annual updates to the inventory are expected to take less time/effort and turn into a routine accounting task.