Project summary
Regenerative agriculture utilizes techniques like conservation tillage, cover crops and crop rotation to build up and sequester carbon in the soil. If yields can be maintained similar to conventional agriculture, then this could be the future of food production. So when a startup snack food manufacturer asked us to quantify the carbon benefits of their crackers made with wheat and other ingredients produced using organic/regenerative methods, we quickly leveraged our tools and database to put together a life cycle assessment (LCA) study comparing crackers made with conventional and organic inputs.
System modeled in this study
The diagram below illustrates the supply chain for a packaged box of sourdough crackers.

The functional unit is a packaged box of crackers (net weight: 4 oz). The system boundary is cradle-to-gate from the perspective of the cracker manufacturer. We used the same supply chain to compare a box of crackers made with conventionally produced wheat and sunflower seed (these are the two primary agricultural inputs to the cracker production) vs. a box of crackers made with organically produced wheat and sunflower seeds. We had actual secondary data for the conventional production systems in our life cycle inventory (LCI) database. We modified these conventional systems to create hypothetical LCA models for organic production systems in order to quantify the benefit of switching to organics.
Organic farming systems are generally characterized by the types of inputs used, such as fertilizers and pesticides that are not synthetically produced and are non-toxic. Based on information from the actual farms that produce the organic ingredients considered in this study, we know that these organic systems also use regenerative farming methods to build and preserve soil carbon. Therefore, we refer to these systems as “organic/regenerative” in this report (or just “organic” for short).
General assumptions
An initial LCA study often starts with a number of assumptions and placeholders that are later refined using higher-quality data. For the two cracker production systems modeled in this study, the data available initially included the list of ingredients (including the weights of ingredients), the production and processing locations of the ingredients, and the co-packer location where the final production and packaging take place. We used secondary data from our LCI database to model the production and processing of the conventionally produced ingredients.
In addition, we made several assumptions and used a number of placeholders as documented below in order to fill in the necessary preliminary data for organic production, waste disposal, processing, packaging, and various minor ingredients:
- For the organic/regenerative farming systems, the on-farm energy use and yield are assumed to be the same as conventional systems for which we have data in our LCI database. Past LCA studies (including one of our own) have shown that organic farming systems often suffer from lower yields relative to a conventional system; however, farming techniques are improving and we expect our assumptions to be replaced with actual data from the specific farms in a future iteration of this LCA study.
- For the organic/regenerative farming systems, the primary fertilizer is assumed to be manure-based compost supplying the same total nitrogen per acre annually as the synthetic fertilizers used in a comparable conventional system. We elaborate on this further in the “Farm-level LCAs” section below.
- For the baking process at the co-packer facility, crackers are assumed to use comparable energy as bread rolls for which we have data in our LCI database.
- Sunflower oil production is assumed to be located near the seed farm, and the waste is composted close to the production facility.
- Although extensive, the LCI database has a finite number of entries, so substitution of products with similar profiles follow: we swapped malt for the yeast extract, acetic acid for lactic acid (since they have similar fermentation processes), and soda powder for baking powder. Each of these substitutions are for an ingredient that comprises 1% or less of the formulation.
- Packaging material is assumed to consist of a 29.08g paperboard carton and a 5g polyethylene (HDPE) plastic liner.
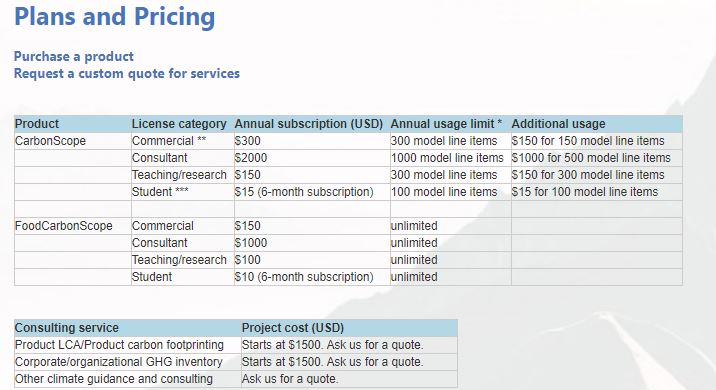
LCA tools and LCI database
We used our new carbon modeling tool, CarbonScope, to conduct the two product LCAs in this project. FoodCarbonScope was used for the farm-level LCAs of the hypothetical organic/regenerative wheat and sunflower seed crop systems. The LCI database underlying the analysis is CarbonScopeData.
Farm-level LCAs
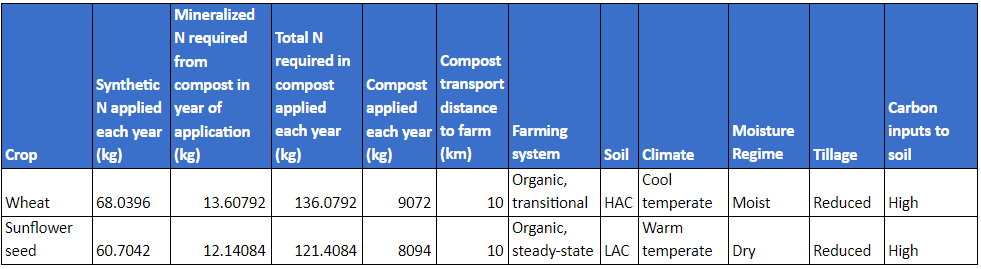
Since we did not have detailed production data for the two primary agricultural inputs used in the manufacture of the crackers — organic wheat and organic sunflower seeds — we created hypothetical organic/regenerative systems based on the conventional production systems for which we had data in CarbonScopeData. We assumed that the energy use and yield per acre would remain the same between conventional and organic systems, and the primary differences would be in the fertilizer application and soil carbon sequestration. The organic farms are assumed to use manure-based compost, based in part on information received from one of the farms, as the primary fertilizer (NPK percentages = 1.5:1:1.5).
We made a few additional and reasonable assumptions about compost:
- Compost mineralizes and releases 10% of the total compost nitrogen per year.
- Compost has been applied long enough that sufficient amounts of total mineralized nitrogen, phosphorus and potassium are available to the crops each year.
- Compost added each year must supply the equivalent of 20% of the synthetic nitrogen through mineralization; the other 80% would come from previous years’ compost applications.
The table below summarizes the key parameters used in the farm-level LCAs of the two commodities. The wheat farming system is considered “transitional” because it is still within a 20-year period following a switch from conventional to organic production. The sunflower seed farming system is considered to be in “steady-state” because the organic production was established more than 20 years ago. The climate and moisture regimes were set based on the locations of the farms. The soil type was set based on information supplied by the farms. The last column in the table sets the carbon inputs to soil as one of four discrete levels (low, medium, high, high-organic), and we chose the “high” level based on our understanding of the farming systems. These parameters are based on IPCC tier 1 methodology, and are used in the farm-level LCAs by FoodCarbonScope to estimate changes in soil carbon during the transition from conventional to organic/regenerative farming.
Of the two crop systems, only the wheat gets credit for soil carbon sequestration as it transitions from a conventional system to an organic/regenerative system. Soil carbon generally increases during such a transition as illustrated below and is calculated using the parameters summarized above. The numbers in the diagram below are for illustration only and do not represent the actual systems modeled in this study.

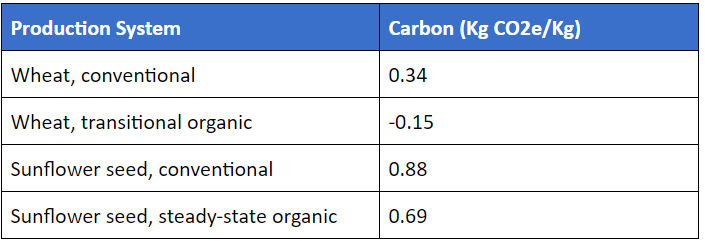
The table below summarizes the cradle-to-farmgate LCA results for the two agricultural commodities considered in this study:
Product LCA results
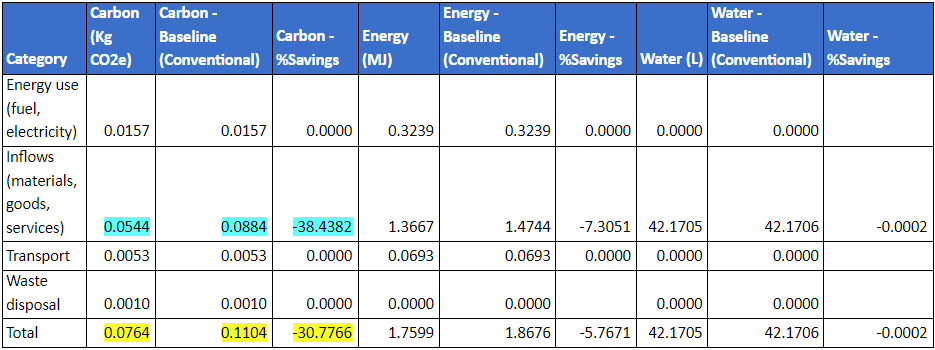
The table below compares the life-cycle impacts of a box of crackers made with organic ingredients produced using regenerative methods vs. crackers made with conventionally produced ingredients. Organic production results in 30% lower greenhouse gas emissions (quantified as Kg CO2e), and all of this is attributable to the difference in agricultural methods. This difference arises from the “Inflows” category which includes the purchased agricultural commodities. The LCA results clearly show the benefits of switching to organic/regenerative production, but with the caveat that credit for soil carbon accumulation can only be taken during the transition period.
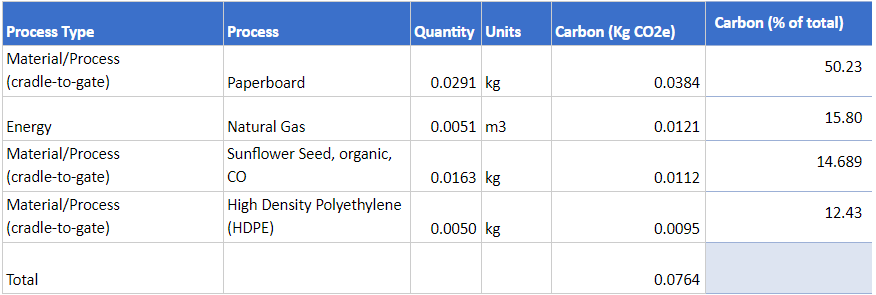
The other interesting insight from the results is that packaging dominates the life-cycle impacts of the products. When the ingredients are plant-based with fairly low carbon emissions, transportation and packaging can sometimes take on an outsized role. The table below shows the top four contributors to carbon emissions in the life cycle of the organic cracker product. Two of these are the packaging materials. The paperboard used to make the carton contributes about half of the total carbon footprint of the finished product.
Conclusion
This LCA study has demonstrated the significant potential for reducing the cradle-to-gate greenhouse gas emissions of the client’s cracker product by sourcing agricultural commodities from farms that are using organic/regenerative methods. It should be noted that the actual supply-chain data for the production was supplemented with several assumptions and placeholders, so these results should be treated as the first step in the process of quantifying and optimizing the climate impacts of the cracker products.