Susan Cholette and Hoa Nguyen
Project summary
Hydration is a necessity, and the growing consumer shift away from soft drinks towards water should please dentists and physicians alike. However, as worldwide demand has surpassed half a trillion bottles per year, single use plastic bottles are not the healthiest choice for the planet. We compare several scenarios for quenching thirst on the go, and show how our purchasing habits can make a substantive impact.
Systems modeled in this study
We evaluate four different ways to provide a thirsty Bay Area consumer a half-liter of water: imported bottled water, more locally sourced water bottled in both virgin and 100% recycled PET bottles, and a reusable container that can be refilled as needed.
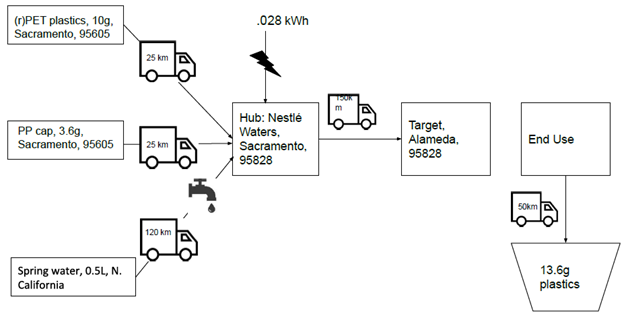
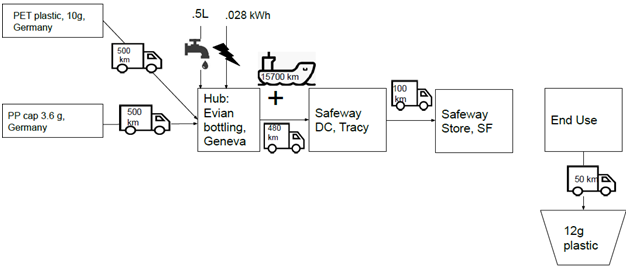
The following figures illustrate the supply chains for a 500ml bottle of Evian, imported from Switzerland, and Arrowhead™, which sources from Californian springs. According to their website all of Arrowhead™’s individually sized bottles sold in California are currently comprised of a 50/50 mix of virgin and recycled PET, but they indicate their bottle design can support use of 100% recycled content and will eventually. Some other drink companies, such as Snapple™ have recently re-designed their bottles to use 100% recycled content. We consider both extremes for recycled content- 0% and 100%- to illustrate the relative impact that recycling has, and we assume that the recycled PET is sourced from the same location as virgin PET.
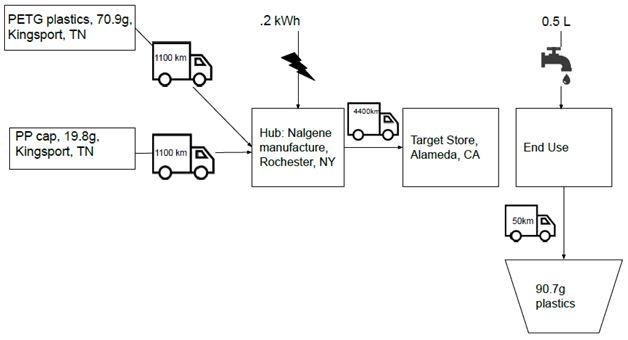
While consumers have many options for reusable containers, we select a Nalgene™ bottle to keep within the same family of materials, as it is made of Tritan™, a popular form of PETG plastic. Unlike the prior three scenarios, where the functional unit is a half liter bottle of water, the functional unit is just the Nalgene™ bottle itself, as it is purchased empty and then filled at home or at a drinking fountain, as shown in Figure 3. We assume that no additional filtration or treatment is used.
All four scenarios share the same system boundary, cradle-to-grave, where we assume that the bottles are trucked to landfill once discarded, as only about 30% of plastic containers are recycled in the US.
LCA tool and LCI database
We used our carbon modeling tool, CarbonScope, to conduct the LCAs in this project. The life-cycle inventory (LCI) database underlying the analysis is CarbonScopeData.
Results
The three life-cycle impact categories that can be quantified are embodied carbon (kg CO2e), embodied energy (MJ) and embodied water (L), but to keep the comparisons simple, we report only embodied carbon. Other studies published elsewhere discuss the additional problem of landfill usage and pollution from bottles that escape proper disposal.
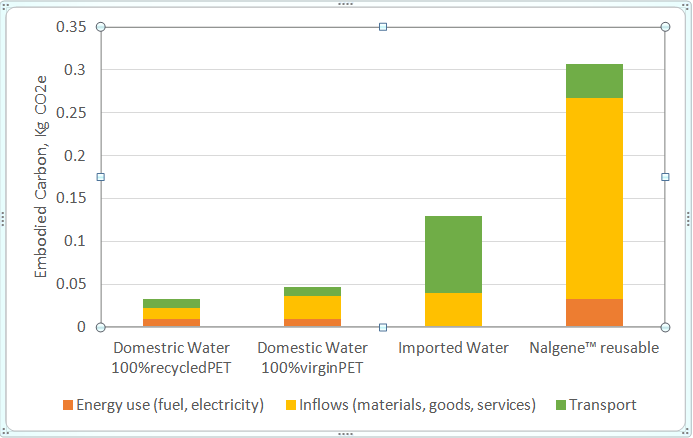
Figure 4 shows the relative impacts of each of the bottles and the contribution for each stage towards embodied carbon. The domestically sourced water bottled in 100% recycled PET has the lowest footprint, a 30% reduction over the virgin PET bottle. Imported water has almost three times the footprint, thanks to the international transportation required. Figure 4 also shows that distance trumps recycled content: even if we were to buy an imported brand bottled in 100% recycled materials, it is clear that it would have more embodied carbon than the domestic water bottled in virgin PET. The reusable container has the most embodied carbon due to its greater weight, more energy-intensive material, and the need to transport it across the country.
Of course, it would be silly to purchase a reusable container for one time use. Figure 5 illustrates the how cumulative carbon footprint increases with the number of uses. We include the .001 kg CO2e associated with pumping and treating tap water, a miniscule impact that effectively results in a flat line for the Nalgene™ reusable bottle no matter how many times it is refilled.
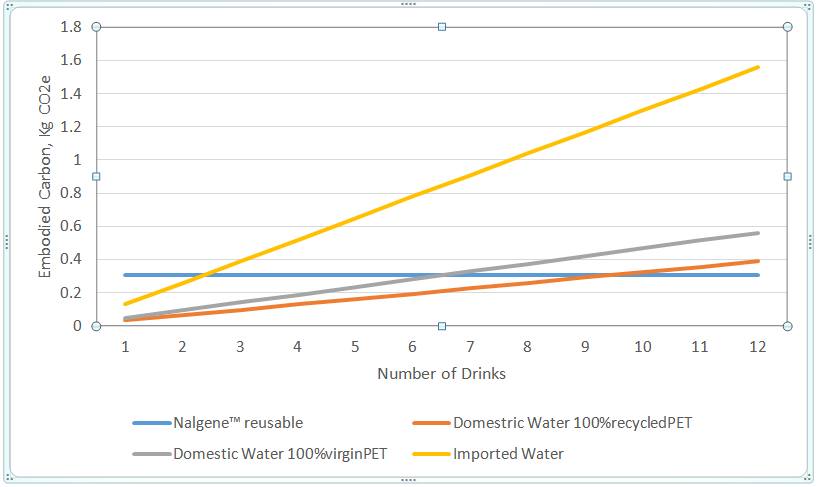
The initial investment in a reusable bottle pays off quickly: we need only use it three times over the purchase of imported water to accumulate less embodied carbon. We would need to reuse a Nalgene™ bottle just more than six or nine times to have a lower footprint than domestically sourced water bottled in virgin or recycled PET. Given that such containers sell for $10 or more, it is likely that we would break even environmentally before we do financially.
While metal or glass containers will have different footprints, the environmental benefit of using reusable drinking containers will be even more advantageous than it is for shopping bags, with one study showing it may take more than 170 uses to offset the investment in a cotton bag over the typical HDPE bags provided at checkout. This is understandable since the transportation of water is inherently emissions intensive. For example, even though the domestic water is sourced from relatively nearby springs, the transport of the water comprises over 20% of the total footprint, while the pumping and treatment of the water is less than 1%. Other domestic brands that use out of state water sources will have a higher transportation footprint.
Conclusions
In summary, the best choice for hydration is to develop a habit of bringing along a reusable container. If that is not an option, then buy a brand of bottled water that is more locally sourced, as distance has a larger impact than the percent of recycled content in the bottle. Imported water should be consumed sparingly, regardless of how it is packaged. Thankfully, imported bottled water has a small and shrinking share of the overall market for still water: only one brand (Fiji) is represented in the top brands that comprise 75% of the US market, and it has a small (3%) share.
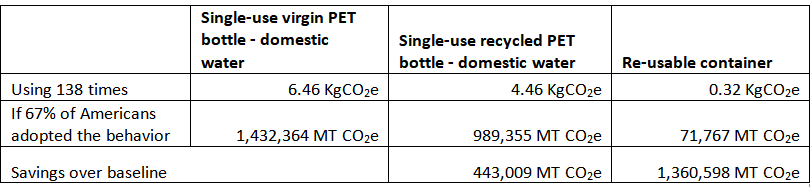
Americans currently purchase an average of 36.5 gallons of bottled water annually, about 275 500ml bottles. While some purchases of single-use water bottles may be necessary, if 200 million Americans obtained a reusable container and replaced half of their yearly bottled water purchases by refilling these containers at taps or drinking fountains, Table 1 shows we could avoid over 1.3 million metric tons of CO2e emissions annually. While this represents only 0.025% of the national annual emissions, this would be a relatively painless behavior to adopt. Small drops do add up.