An annual corporate greenhouse gas (GHG) emissions inventory – if done correctly – can tell you exactly where your company or organization stands as far as its climate impact and how that changes over time. It is a starting point for serious climate action that could ultimately include switching to green electricity, cutting transport emissions, using lower-emissions materials, reducing waste and purchasing high-quality carbon offsets.
But GHG inventories are notoriously time-consuming and difficult to compile, and they often require a level of expertise that most small and medium-sized enterprises do not have. This problem was front and center in our minds as we architected and developed our new carbon modeling tool, CarbonScope. As we said in a recent Medium post: If we are going to bend the emissions curve, then a majority of businesses need to get involved, and emissions accounting must become as commonplace as financial accounting.
While CarbonScope allows for some very sophisticated modeling, we want to focus here on the simplest and quickest way to compile a corporate GHG inventory that you can put to use immediately. CarbonScope is a web app designed for interactive data input and use. To keep things simple, we will propose entering all of the activity data into a spreadsheet and then uploading it into CarbonScope. Once the data is in CarbonScope, you can switch to an interactive mode for the rest of the analysis.
This simple method uses hybrid life-cycle inventory (LCI) data under the hood:
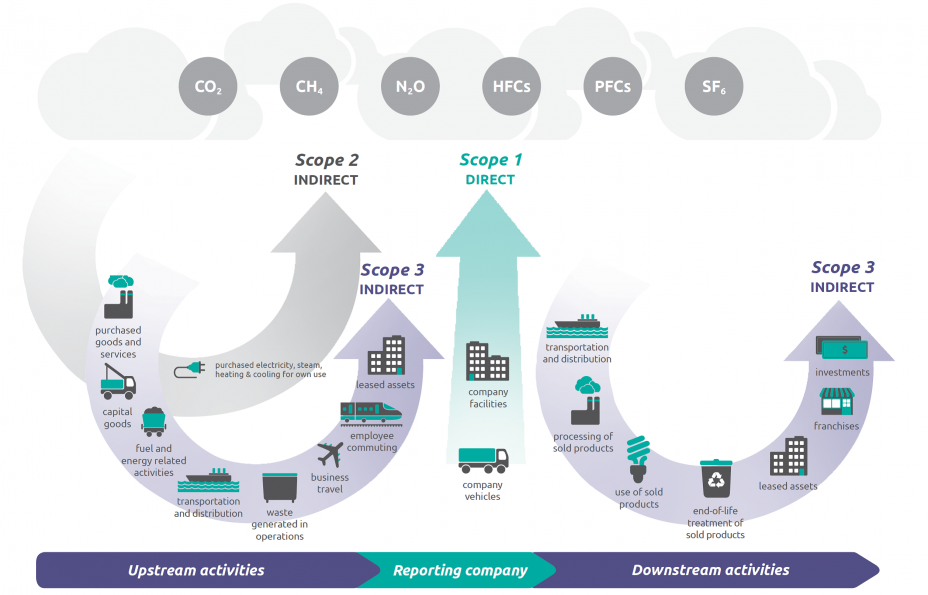
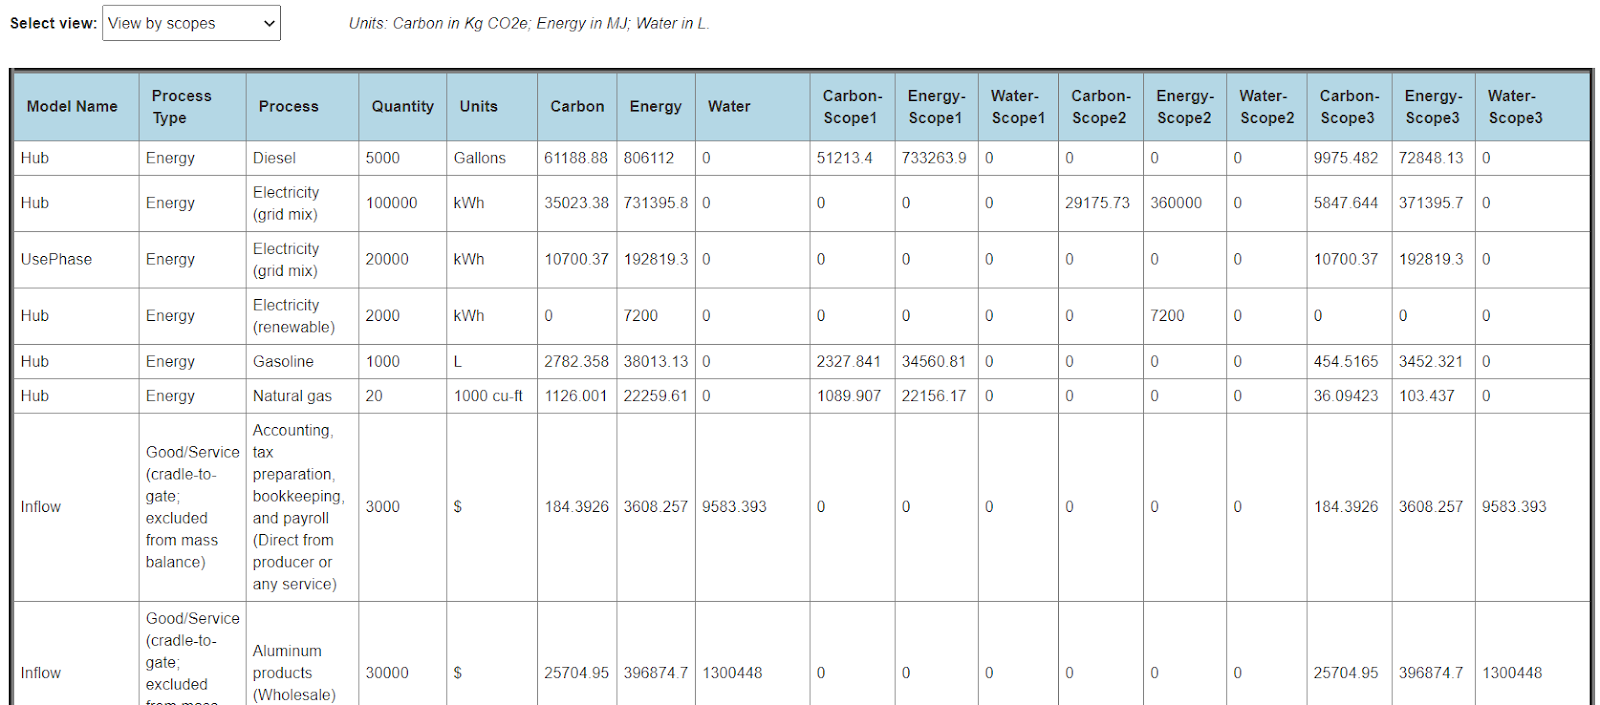
- All of the emissions in scope 1 (direct fuel combustion) and scope 2 (purchased electricity) are modeled using our process LCI (PLCI) database. This is the easy part.
- The wide range of emissions in scope 3 are modeled largely using our environmentally extended input-output LCI (EEIOLCI) database, which converts dollar amounts from purchase records into equivalent GHG emissions, energy use and water use based on the industry sector (or equivalently, NAICS code). This is the difficult part that we have simplified and automated to a large extent.
This hybrid method is available to companies that are using CarbonScope themselves, as well as to those that utilize our consulting services.
Compile activity data
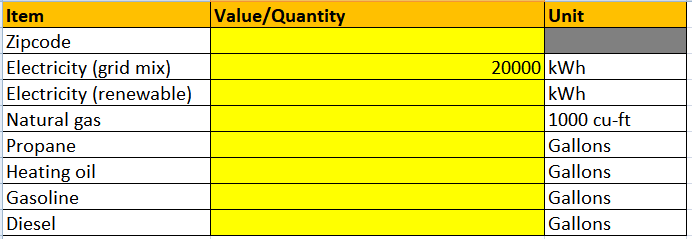
We have an example of the activity data template here with some sample data filled in for a hypothetical company. Note that this data is for a one year period. The spreadsheet contains seven sheets:
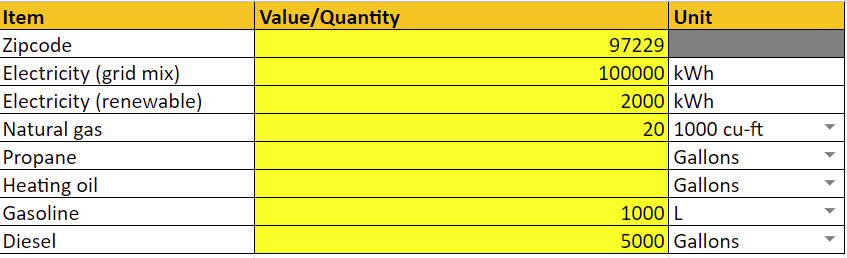
- Hub: This is the company’s primary location (or it could be the location of a division, subsidiary or department). Here we would fill in the quantities of all purchased fuels and electricity, accounting for all of the scope 1 and 2 emissions (and some scope 3 emissions as well). A zipcode is required in order to find the correct electric grid emission factor in the US (alternately, you can enter a country name here for international locations). A blank zipcode defaults to US average electric grid emissions.
- Inflow: This sheet captures all of the purchased materials, goods and services. The cool thing about this is that CarbonScope can work with dollar amounts (excluding local/state taxes) that you spent on your purchases from one or more of 385 industry sectors that cover the entire US economy. You can just convert your purchasing records into dollar amounts that can be used to represent most of the scope 3 emissions, resulting in significant savings of time and effort.

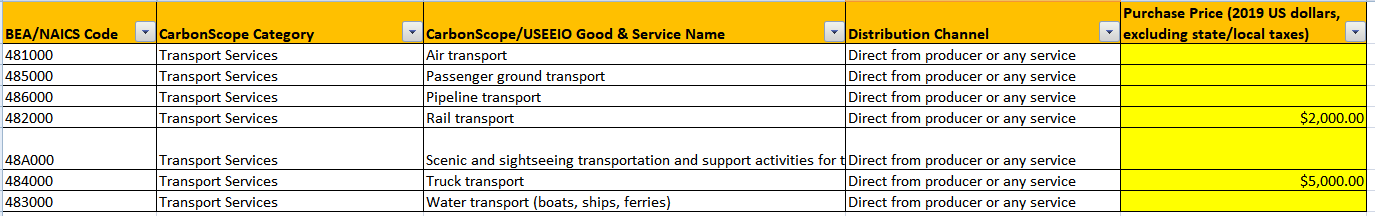
- Outflow: This sheet captures all of the third-party freight transport that you paid for. It is also in dollar amounts similar to the inflow. This contributes to scope 3 emissions.
- Waste: This sheet captures all of the waste management, water and wastewater services that you paid for. It is also in dollar amounts similar to the inflow. This contributes to scope 3 emissions.

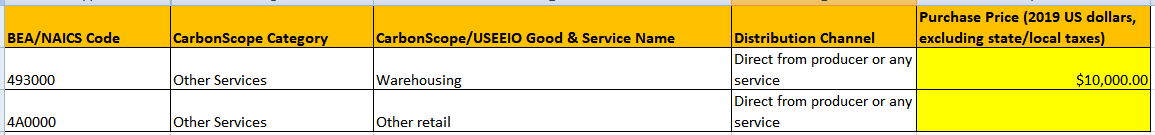
- Storage: This sheet captures all of the third-party warehousing or other storage of your products that you paid for. It is also in dollar amounts similar to the inflow. This contributes to scope 3 emissions.
- Use Phase: This sheet captures the estimated electricity and fuels consumed in the usage of your products, or in the further processing of your products in the value chain. This contributes to scope 3 emissions. A blank zipcode defaults to US average electric grid emissions.
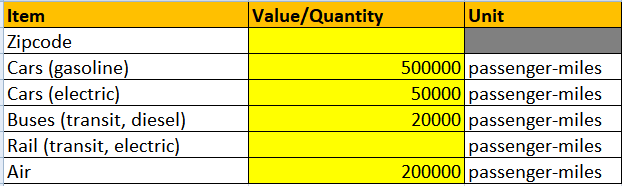
- Employee Travel: This sheet captures all of the employee business travel and commuting in passenger miles on various transport modes. It is the total across the entire company (or division, department, etc.). This contributes to scope 3 emissions. A blank zipcode defaults to US average electric grid emissions.
Upload activity data
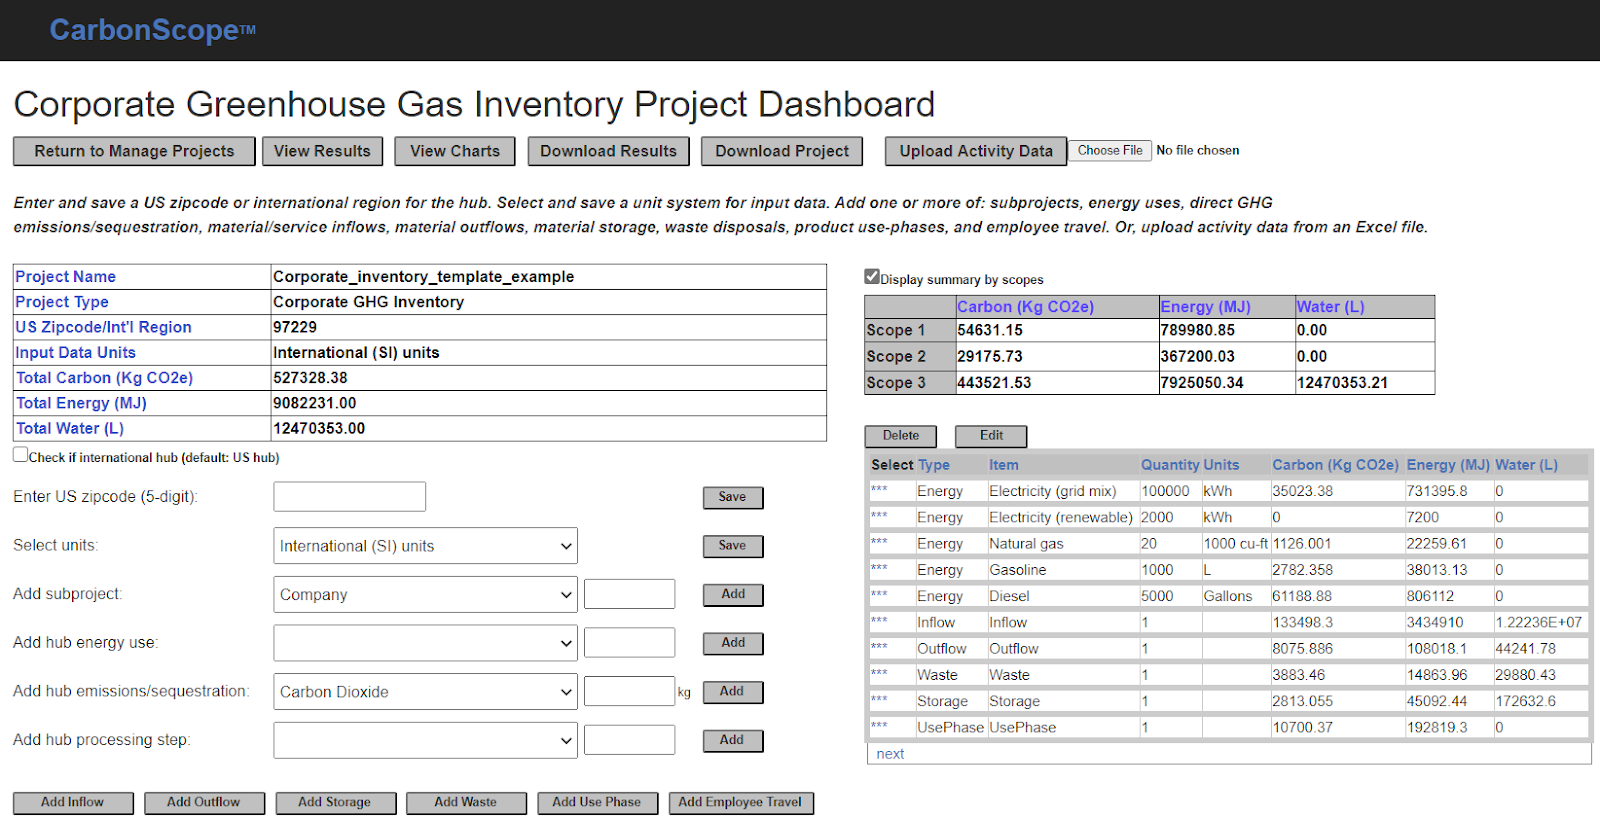
This spreadsheet with its seven sheets can be uploaded into a blank GHG inventory project in CarbonScope by selecting the Excel file and clicking “Upload Activity Data” in the CarbonScope GHG inventory dashboard. The upload will automatically populate the project and calculate all of the carbon, energy and water results in detail. At this point, all of the analysis is automatically done and summary results can be seen on the dashboard as shown below. It is as simple as that.
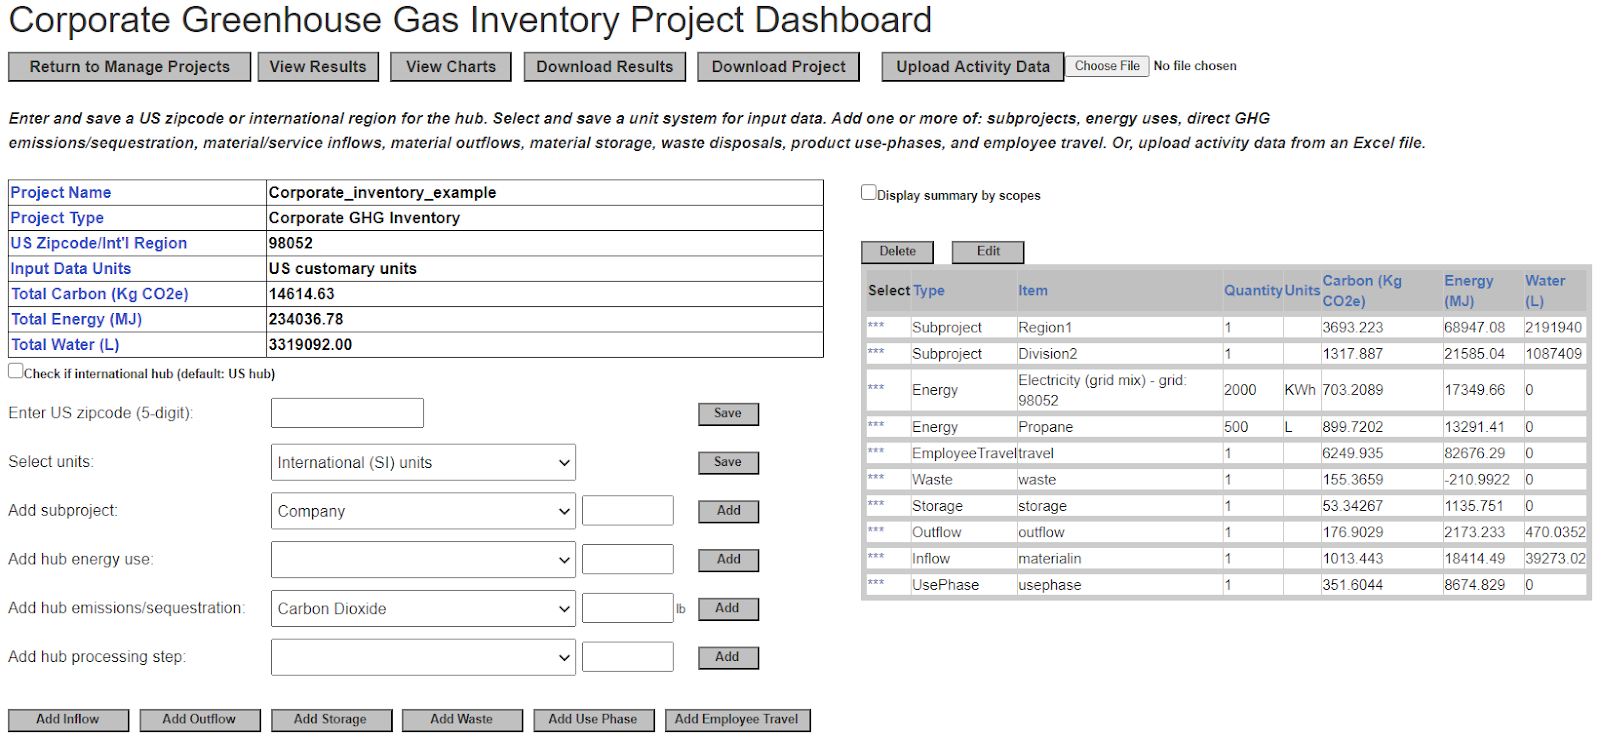
Note: If the company has multiple locations, divisions or subsidiaries that need to be modeled separately, you would need to fill out one copy of the spreadsheet for each of these and upload each spreadsheet into a separate GHG inventory project. Then, you would instantiate these other projects as subprojects within the GHG inventory project for the main location or the company headquarters as shown below.
View and download results
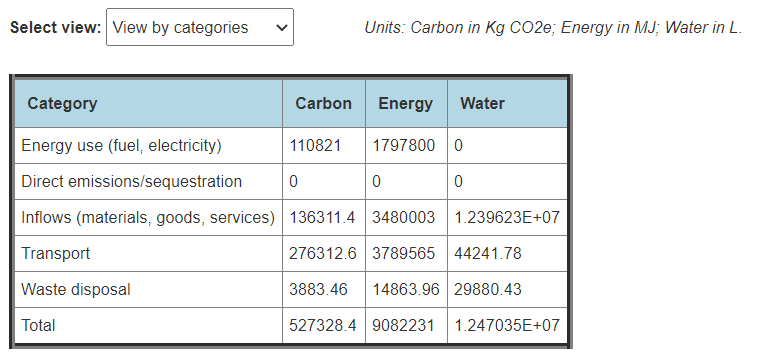
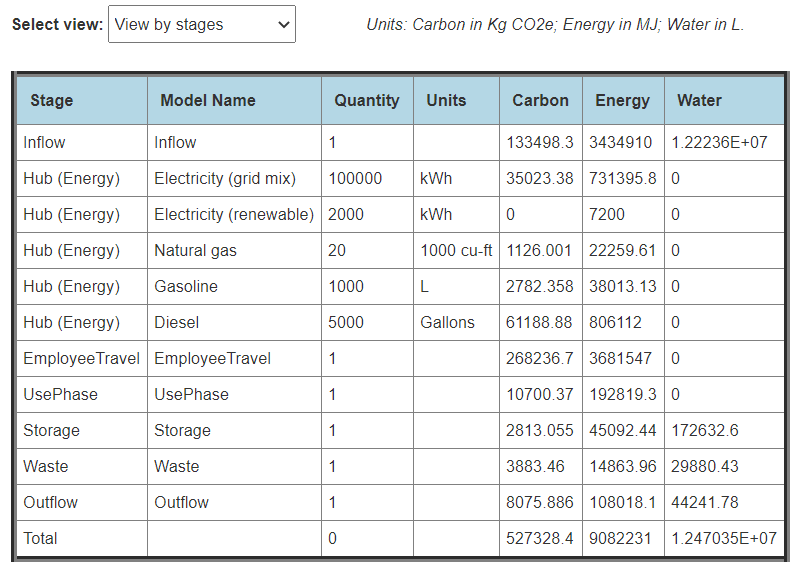
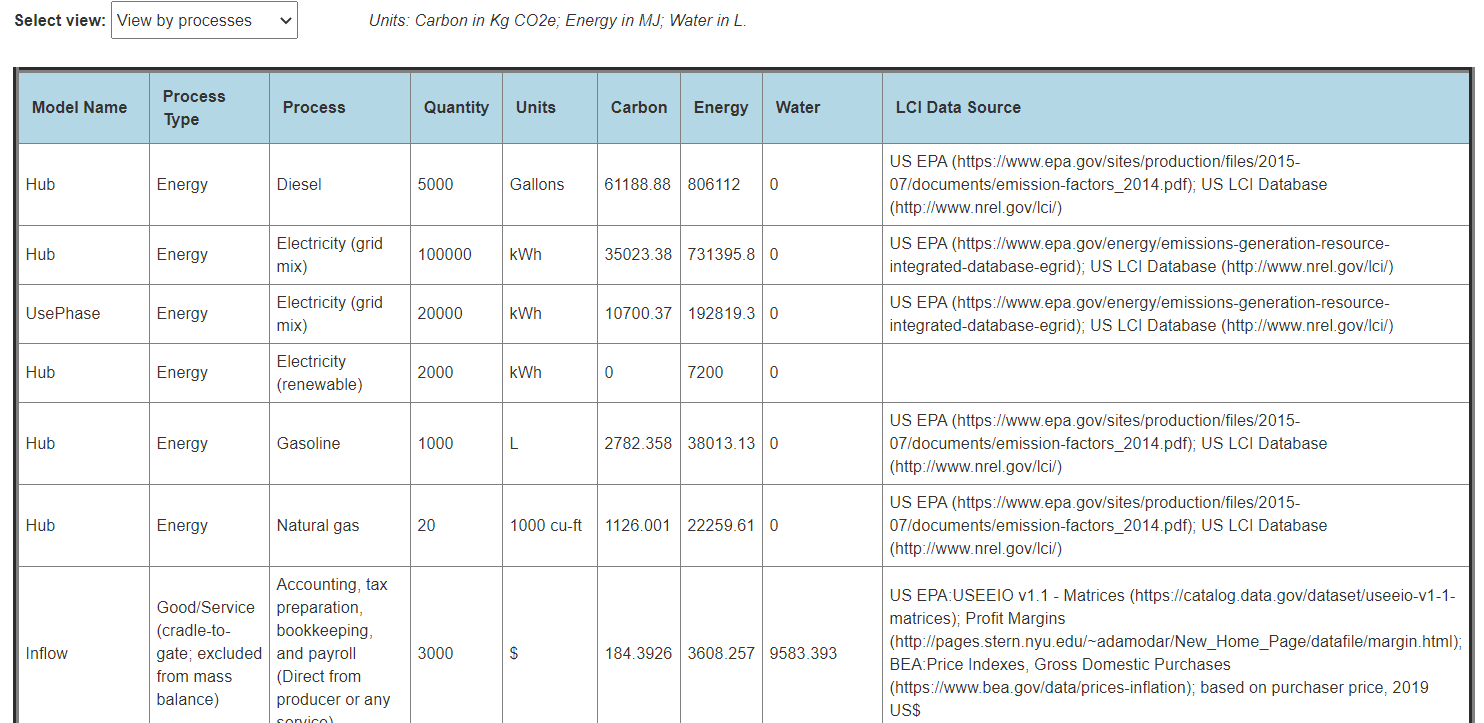
The full GHG inventory results can be downloaded by clicking “Download Results” on the dashboard. You can see the results for the above hypothetical example here. You can slice and dice the results as needed, and create your own custom reports.
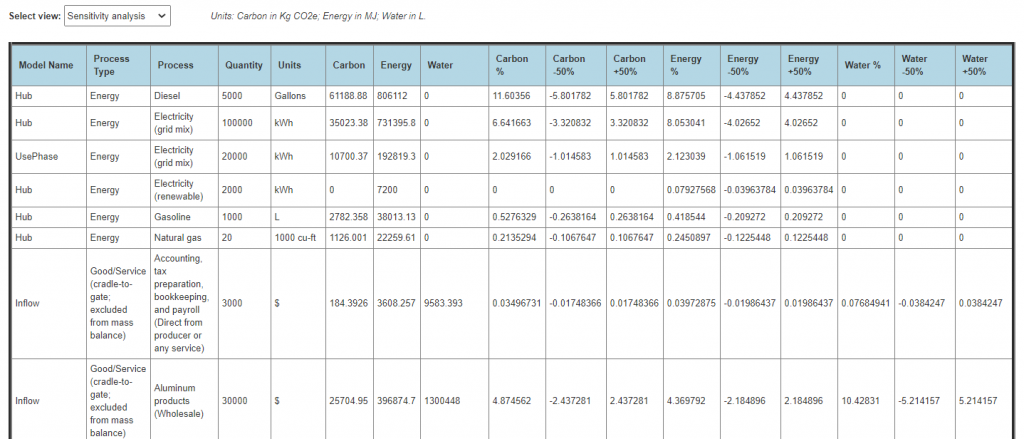
The same basic results can be viewed online by clicking “View Results” (to view as tables) or “View Charts” (to view as charts) on the dashboard and then selecting the desired “view” in the new browser tab that opens up. The results can be viewed by category, stages, processes or scopes as shown below. A sensitivity analysis table is also available.
______________________________________________________________________
______________________________________________________________________
_____________________________________________________________________
_____________________________________________________________________
______________________________________________________________________
Correct usage of the hybrid methodology
The hybrid methodology outlined here — combining PLCI (for accurate scope 1/2 emissions and some scope 3 emissions) and EEIOLCI (for 100% coverage of most scope 3 emissions) — can be very effective in compiling corporate GHG inventories.
A limitation of EEIOLCI is that it cannot be used for evaluating the relative impacts of process improvements or material substitutions within an industry sector, or for comparing the environmental impacts of two similar products, due to the data aggregation by industry sector.
This hybrid methodology can be used to quickly establish a baseline GHG inventory and can help screen for hot spots that may require more attention. Emission reduction targets can be set immediately for scopes 1 and 2 in accordance with Science Based Targets or other reduction plans. The inventory results can also be used directly to purchase high-quality carbon offsets as part of a broader corporate climate strategy to address all emission scopes.
With the sensitivity analysis that CarbonScope performs automatically, it is straightforward to identify the scope 3 items that the GHG inventory is most sensitive to. Based on this, some of the scope 3 items (especially the inflows of goods and services into the company/organization) could be selectively modeled using PLCI in a second iteration for more accuracy as well as to evaluate process improvements or material substitutions in order to set and achieve scope 3 emission reduction targets. Alternately, it might be useful to look at categories like employee travel for possible scope 3 emission reductions while keeping the convenient EEIOLCI modeling for inflows.