
Project summary
Americans lead the world in coffee consumption with 400 million cups of coffee consumed per day. Per-capita coffee consumption is even higher in European countries. With coffee consumption comes carbon emissions, and we thought it would be interesting to do a life-cycle comparison of the environmental impacts of three popular coffee drinks that you could order at a neighborhood cafe: a latte with 2% milk, a latte with soy milk, and a cappuccino with 2% milk.
Systems modeled in the study
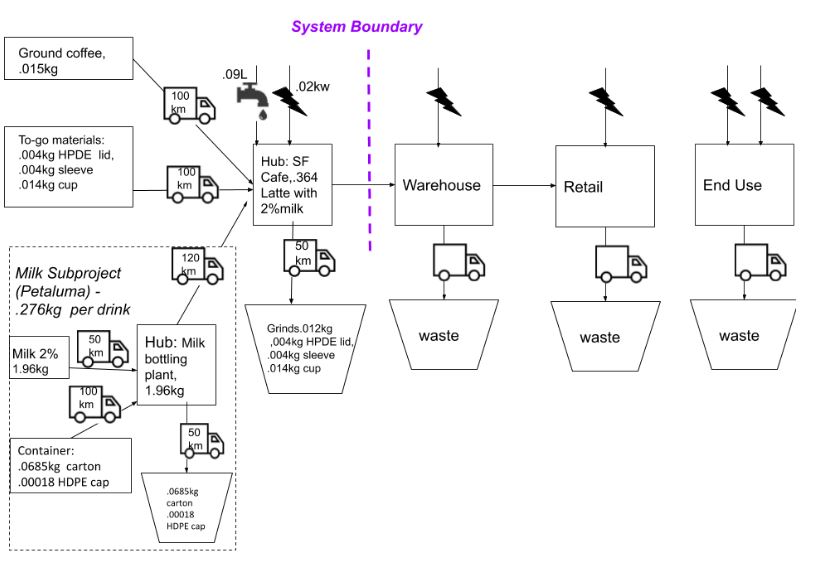
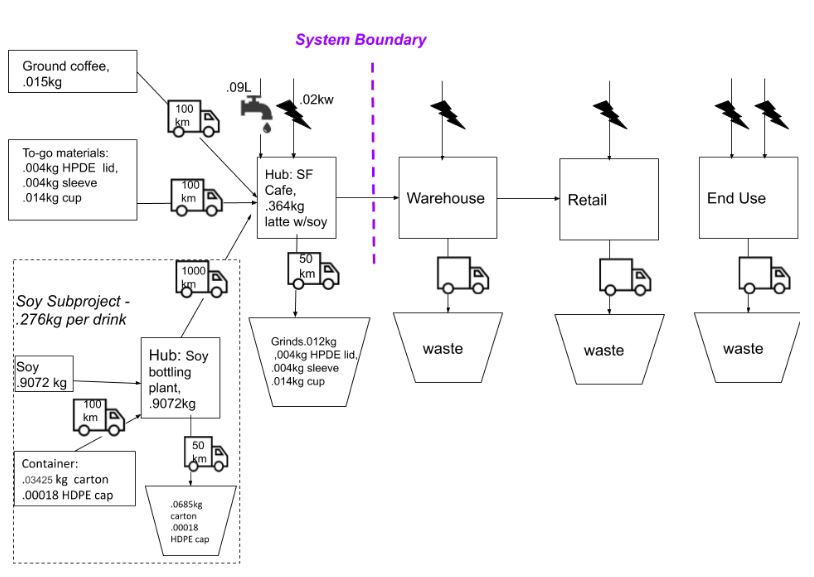
The diagrams below illustrate the supply chains for both lattes modeled in this study. Milk is sourced relatively locally in half-gallon containers, whereas soy milk is produced more distantly and in smaller containers. The cappuccino’s ingredients and sourcing are inherently similar to that for the latte with 2% milk, but just with less milk added and more power used for frothing the milk. The functional unit for the LCA is a 12oz latte and a 6oz cappuccino. The cappuccino has 6oz less milk in it, but otherwise has the same coffee/water ratio. Although we could have modeled the cappuccino with a shorter cup, we decided to use the same cup size for all drinks because coffee cups of different sizes are surprisingly similar in weight. The system boundary is cradle-to-grave in all cases, with the to-go cup disposed of at the cafe.
LCA tool and LCI database
We used our new carbon modeling tool, CarbonScope, to conduct the LCAs in this project. The life-cycle inventory (LCI) database underlying the analysis is CarbonScopeData.
Results
The three life-cycle impact categories considered in this study are embodied carbon (Kg CO2e), embodied energy (MJ) and embodied water (L). We first consider the embodied carbon associated with a Latte made with 2% milk, grouping all processes as associated with the primary ingredient. Figure 3 shows that the largest component is from the milk, with the second largest impact from the packaging. Despite being sourced from afar, coffee’s impact is relatively small.

Replacing to-go materials with one’s own trusted travel mug would allow one to enjoy a free latte every 6th time from a carbon equivalence perspective, if we ignore the impact of producing and then repeatedly washing the mug. But for now we will for now focus on the highest impact ingredient: the milk. Our first alternative replaces the 2% milk with soymilk, and the second is the cappuccino, which uses only 3 ounces of milk instead of the 9 used by a latte.
The table below summarizes the LCA results. While a latte with soy milk has less embodied water than milk, there is no effective difference in the embodied carbon. Part of this is due to the longer supply chain for soymilk, the greater share of the smaller package, and the inherent energy intensity of soymilk production. Other alternative milks would have different impacts.
We then consider a different drink for the third alternative. The cappuccino shows the significantly lower environmental impacts from consuming less milk, only having 55% of the embodied carbon and, not-surprisingly, one-third the water. The increased energy usage from frothing the milk is more than offset by reducing the milk used.

Overall, this study shows that milk (or soymilk) dominates the carbon footprint of a latte. The coffee itself is a minor contributor. So habitual latte drinkers should not fret about their coffee addiction (at least from an environmental perspective), but they might consider switching to a less milky drink, and everyone can consider bringing back reusable mugs when it is again safe to do so.